Dynamics 365 Field services mobile app debugging
This is an overview of how to build and debug a Dynamics 365 Field Services Mobile Application using Resco’s Woodford mobile framework (JavaScript library)
Please let me know if you have a better way to manage this development life cycle. Id be keen to improve the experience.
What does the mobile application look like?
The project solution on disk
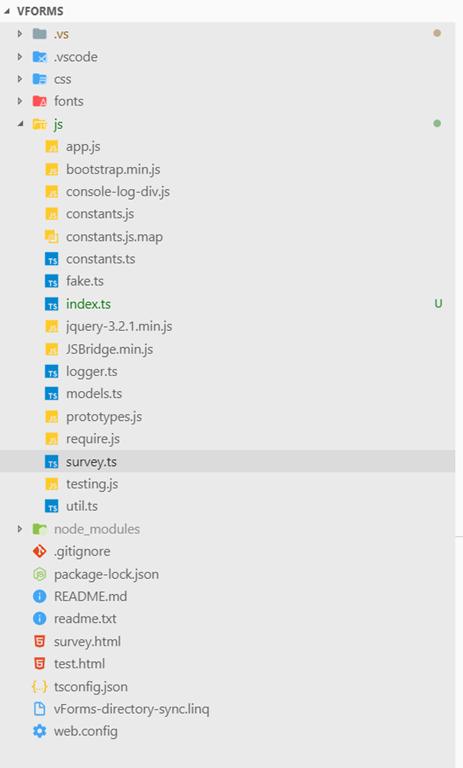
This project uses TypeScript with VS Code. Typescript helped catch lots of issues before deployment.
Requirements to build and debug the solution
- Latest Typescript
- Visual Studio 2015 +
- LINQ Pad (just to copy the local dev files to the local Window Store Field Service App folder)
- Field Service – Dynamics 365 application installed

How do I build the solution?
Step 1
After setting up the files locally (mine are at c:\dev\vForms ) run the following commands in the root directory –> _npm install

This should give you the TypeScript jQuery & Sizzle files for intellisense in VS Code / Visual Studio


Step 2
To compile the TypeScript files to JavaScript (.ts –> .js) run the command –> tsc –w (-w is watch mode so any saved change to a .TS file will trigger a compile)
Step 3
Open up the file ‘vForms-directory-sync.linq’
Here we need to replace the highlighted yellow with your local Field Service application data package directory

Run this script and it will ‘watch’ your development files and copy them to the local Field Service application folder upon change.
Warning: The Field Service application may occasional lock the file. And to refresh the view/execution of the files you need to exit the screen using them – then go back in (no Hot Module Replacement here I am afraid!)
How do I debug the solution?
To help with debugging I have set a global Boolean variable DEBUG_ENABLED which optionally may be triggered remotely via the ‘msdyn_showtechnicalhelp’ field for a survey.
Three steps are required to attach & debug the JavaScript/Typescript files
Step 1
Follow the steps to setup your IE settings outlined here
https://www.resco.net/debugging-offline-html-solution/
Step 2
In your TypeScript/JavasScript file put the word ‘debugger’ to break out into a debug session

Step 3

Attach Visual Studio to the MobileCrm.exe process
Voila – you should be able to attach & debug the running JavaScript (note may take a few goes to warm up)


Published: